Why Hackers Prefer Linux · Volume 2
The Toolchain Argument
The strongest case for Linux is not philosophical. It is that a set of specific, common tasks are straightforward on Linux, awkward on macOS and, on Windows, dependent on a vendor’s driver having exposed a capability it had no commercial reason to expose. This volume works through the clearest of those tasks. Each is chosen because the difference between platforms is structural — a consequence of where the code lives and who controls it — rather than a matter of which tools happen to have been ported.
2.1 Getting at the radio
Wireless work is the cleanest example, because the capability either exists or it does not and the outcome is easy to test.
An 802.11 interface normally operates in managed mode: it associates with an access point and hands the operating system Ethernet-shaped frames, having already discarded management and control traffic. Every interesting question in wireless security — what networks are probing, how a client handshakes, whether a deauthentication frame is in the air — concerns exactly the frames that mode throws away. Answering them requires monitor mode, in which the card reports every frame it hears on the current channel, and often requires the ability to set that channel and to transmit crafted frames.
On Linux this is kernel functionality. cfg80211 and mac80211 are in the mainline tree, monitor mode is a standard interface type, and the capability can be interrogated directly:
$ iw list
    Supported interface modes:
         * IBSS
         * managed
         * AP
         * AP/VLAN
         * monitor
         * P2P-client
         * P2P-GO
         * P2P-device
That listing is from the ordinary laptop used to prepare this writeup — not a security distribution, not special hardware. Frames captured this way arrive with a radiotap header carrying signal strength, data rate and channel, which is what turns a capture into an analysable measurement rather than a pile of bytes.
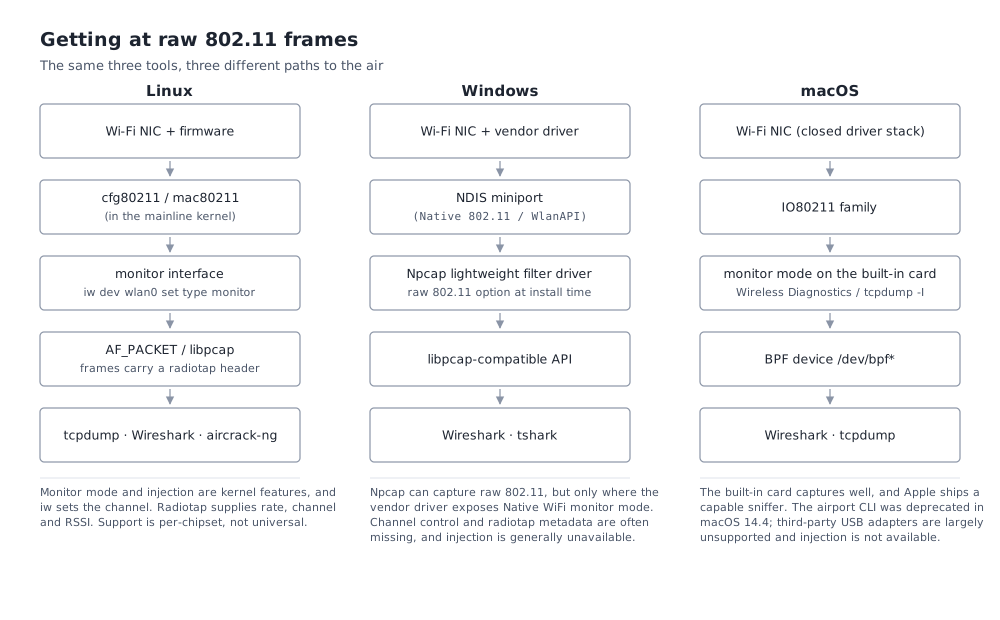
The comparison is genuinely mixed rather than one-sided, and the diagram above is drawn to show that.
Windows can capture raw 802.11. Npcap installs a lightweight filter driver with a raw-wireless option and will put an adapter into monitor mode — where the vendor’s driver exposes Native WiFi monitor mode. The Npcap documentation and the Wireshark wiki are candid about what follows: hardware support is limited, channel control frequently is not available, only some modulations may be captured, and radiotap metadata such as signal strength and rate is often absent. Injection is generally not available at all.
macOS does better than its reputation. Monitor mode works on the built-in card, Apple ships a capable capture front end in Wireless Diagnostics, and tcpdump -I works. The limitations are different in kind: the driver stack is closed, third-party USB adapters are largely unsupported, injection is not available, and the long-serving airport command-line utility was deprecated in macOS 14.4, pushing scripted work toward wdutil and the diagnostics app.
The structural difference is therefore not “Linux can and others cannot”. It is that on Linux the capability is a property of the kernel that ships to everyone and is documented, scriptable and consistent across adapters that the driver supports; elsewhere it is a property of a specific vendor’s driver, exposed at that vendor’s discretion, with metadata that may or may not arrive.
2.2 Instrumenting a running system
The second structural advantage is the ability to watch a process, a syscall or a kernel function without the cooperation of whoever wrote them.
Linux exposes kernel and process state as a filesystem. /proc/<pid>/maps prints a process’s memory layout; /proc/<pid>/fd lists its open files as symlinks; /sys exposes device and driver state the same way. None of this requires a special API — the ordinary text-processing tools work on it, which is the subject of the next volume.
Above that sit three layers of instrumentation, all of which were present on the plain workstation used for this writeup:
ptrace-based tools —stracefor syscalls,gdbfor debugging. Attaching to a running process and watching every system call it makes is a default capability, not a purchase.perf— hardware performance counters, sampling profiles, kernel and userspace stacks.- eBPF — programs verified and loaded into the running kernel to observe syscalls, network events, filesystem operations or arbitrary kernel functions, with tooling such as
bpftracemaking one-off questions answerable in a single line.
The point is not that other systems lack tracing. macOS has DTrace heritage, and Windows has ETW and an unusually good kernel debugger in WinDbg. The point is the absence of gates: no signing requirement, no System Integrity Protection to disable, no vendor agent, and full source for the thing being instrumented, so an unexpected result can be chased into the code that produced it.
2.3 Containers are a Linux feature
Container tooling is not cross-platform software that happens to run best on Linux; it is an interface to Linux kernel facilities. Namespaces, cgroups, and the capability and seccomp machinery are kernel features, and docker and podman are front ends to them.
The consequence is concrete. On Linux, a container is a set of processes on the same kernel, visible in the same process table, traceable with the same tools. On macOS and Windows, Docker Desktop runs a Linux virtual machine, and every container is inside it. For ordinary application development the difference is a performance and file-sharing annoyance. For anyone investigating container escapes, namespace behaviour, cgroup limits or kernel attack surface, the difference is that on Linux the object of study is present and on the others it is one layer of indirection away, inside a VM whose configuration is the vendor’s.
2.4 Parity with the target
The least glamorous argument is possibly the strongest. Public-facing servers, cloud instances, Kubernetes nodes, CI runners and the overwhelming majority of embedded devices run Linux. For anyone whose work is on those systems, the workstation and the target share a kernel, a libc, a package format, a filesystem layout and a shell.
That parity pays out constantly: a script written locally runs on the target; a binary built locally executes there; a core dump from production opens in the local debugger with matching symbols; a container image built on the laptop is the artefact that ships. Every one of those is a small thing, and the accumulation of them is why server-side practitioners tend not to think of the choice as a choice.
The symmetrical version of this argument appears in the final volume and is equally valid: for practitioners whose targets are corporate Windows endpoints or Apple devices, parity points the other way, and it points there just as hard.
2.5 What this argument does not establish
Three honest qualifications belong here rather than buried later.
The flagship analysis tools are portable. Wireshark, Ghidra, Frida, Burp Suite, Nmap and radare2 all run on all three platforms. Anyone whose work is primarily analysis of already-captured data can do it anywhere, and many do.
Hardware support is per-chipset, not per-platform. “Linux supports monitor mode” is true of the kernel and false of some specific cards; practitioners buy known-good adapters for exactly this reason, which is itself an admission that the capability is not universal.
And the gap is narrowing from the Windows side. WSL2 provides a real Linux kernel and runs the same tooling; Microsoft’s own documentation is clear about what it does not provide, and the next volumes take that seriously rather than dismissing it.
Comments (0)